The missing map of the sky news update: The missing map of the sky
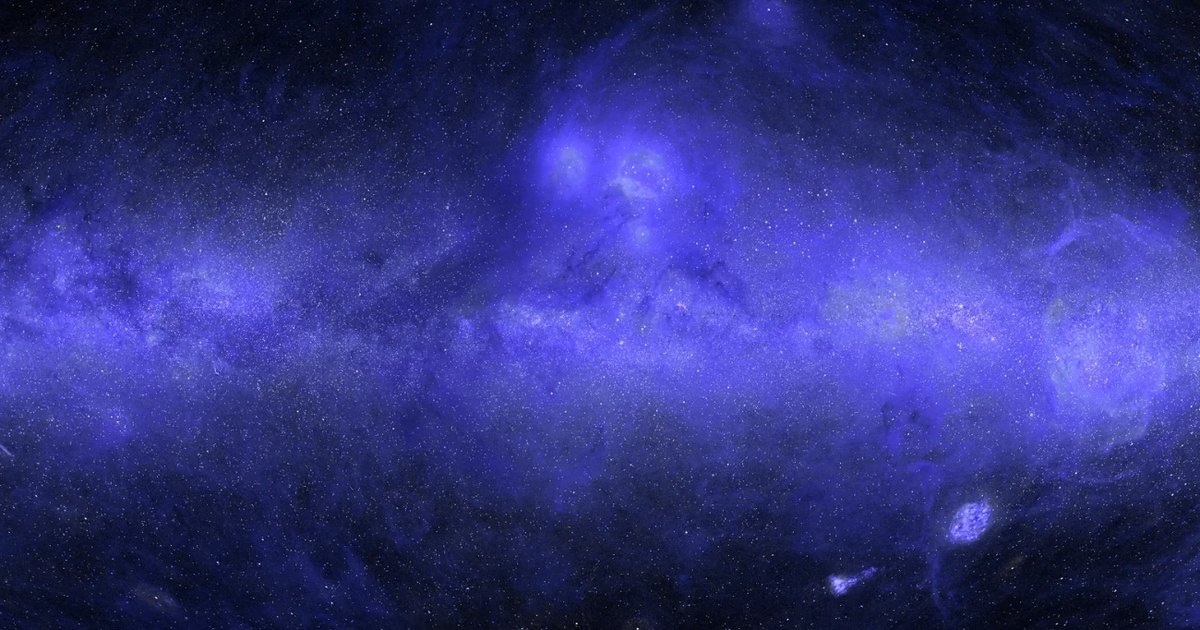
Anthropic researcher Brice Ménard used Claude Science to reconstruct the first complete ultraviolet map of the sky, predicting one-third of unmapped space.
By Dillip Chowdary • Nov 15, 2026 • Source: Anthropic Research
At a glance
- Product
- Claude Science
- Researchers
- Brice Ménard (Johns Hopkins and Anthropic)
- Wavelengths
- Far-UV 154 nm and near-UV 232 nm
- Reconstruction scope
- Approximately one-third of the sky predicted
- Prediction accuracy
- Within about 10% of real UV measurements
- Stellar catalog
- Over 100 million stars from ESA Gaia
Brice Ménard, an astrophysicist at Johns Hopkins University and researcher at Anthropic, utilized Claude Science to generate the first complete ultraviolet map of the sky by combining far-ultraviolet data at 154 nanometers with near-ultraviolet data at 232 nanometers. According to Anthropic Research's report, the model predicted roughly one-third of the celestial sphere, filling persistent observational voids along the galactic plane while tagging every pixel as measured or predicted alongside explicit uncertainty estimates.
This report breaks down how automated AI agents unified disparate historical space missions, filtered atmospheric noise, and deployed multi-spectral machine learning to complete the astronomical record for educators and astrophysics students. It explains the technical calibration workflow, the cross-wavelength estimation strategy, and how autonomous agent execution resolved long-standing data backlogs that human researchers previously set aside.
01Space telescope gaps across the galactic plane
Astronomical observation across diverse electromagnetic wavelengths exposes fundamentally different structural properties of the cosmos, ranging from dense stellar clusters in visible light to cold interstellar gas in radio bands. While infrared surveys highlight dust along the galactic disc and X-rays capture violent black hole accretion, ultraviolet observations specifically reveal interstellar dust illuminated by starlight, young stellar nurseries, and expanding supernova rings.
| Wavelength band | Observed cosmic structure | Physical mechanism |
|---|---|---|
| Visible light | Stellar discs and clusters | Direct optical emissions from stars |
| Infrared | Interstellar dust lanes | Thermal glow along the galactic plane |
| Radio waves | Cold neutral hydrogen | Gaseous raw material forming stars |
| X-rays | High-energy energetic events | Supernova blasts and black hole accretion |
| Ultraviolet | Illuminated dust and nebulae | Starlight reflecting off stellar rings |
Because Earth's atmospheric ozone layer absorbs incoming ultraviolet radiation, astronomers must deploy space telescopes to capture ultraviolet emissions from orbit. Over five decades of space exploration, instruments compiled fragmented coverage rather than an unbroken celestial chart. NASA's Galaxy Evolution Explorer mission captured roughly two-thirds of the sky across 38,000 individual observations between 2003 and 2013, but critical regions remained completely unobserved.
Note: NASA's GALEX satellite deliberately bypassed observation fields containing luminous stars along the Milky Way disk to avoid burning its onboard sensors. While auxiliary datasets from NASA's Swift and South Korea's FIMS/SPEAR filled selected voids, roughly one-third of the ultraviolet sky remained unmapped for decades due to the extensive pixel-level calibration required.
02Multi-agent data ingestion and glare removal
Claude Science initiated construction of the map by coordinating a team of autonomous AI agents programmed to harvest publicly available ultraviolet surveys across the internet. These archives contained tens of thousands of heterogeneous telescope images recorded across differing orbital conditions over several years. The agents downloaded the disparate archives and established baseline internal consistency across disparate observing periods.
- Survey ingestion Autonomous agents located and retrieved thousands of public space telescope observations across the internet.
- Glare removal Parallel worker agents modeled and stripped optical stellar flares around luminous celestial targets.
- Cross-instrument calibration The system standardized pixel resolutions and aligned different telescope datasets onto a single coordinate projection.
- Cross-wavelength inpainting Machine learning models correlated ultraviolet values with visible, infrared, and radio baselines to estimate missing regions.
- Stellar reconstruction The pipeline synthesized UV contributions from over 100 million stars cataloged by the Gaia spacecraft.
Bright stars introduce severe glare into space telescope cameras, obscuring the delicate, faint ultraviolet light scattered by surrounding interstellar gas and dust clouds. Claude deployed specialized subagents to analyze distinct spatial regions in parallel, measuring local optical flare distributions and stripping sensor contamination across thousands of individual exposure frames. This parallelized cleaning process equalized baseline sensitivity across every individual observation footprint.
Once individual surveys achieved internal consistency, the system unified the separate instrument catalogs onto a standardized spatial grid. Because instruments on GALEX, Swift, and FIMS/SPEAR captured ultraviolet frequencies with varying detector geometries and sensitivity thresholds, agents rescaled each image to a shared angular resolution. Claude then harmonized the calibrated exposures within a unified astrometric coordinate system to produce a coherent mosaic.
Advertisement
Tech Pulse Daily
Get tomorrow's pulse first
Join engineers who read Tech Pulse before stand-up. Free, weekday mornings.
03Cross-wavelength inpainting and stellar synthesis
To reconstruct the unobserved one-third of the sky, Claude implemented machine learning inpainting algorithms that infer missing regions from contextual patterns in surrounding data. The system paired incomplete ultraviolet data with comprehensive full-sky surveys conducted at other electromagnetic wavelengths, including visible light, infrared dust maps, and radio hydrogen observations. By analyzing the mapped two-thirds of the sky, the model established mathematical correlations connecting ultraviolet luminosity to multi-wavelength signatures.
The model then applied these learned relationships across previously unmeasured coordinates on the galactic plane, calculating expected ultraviolet values and associated confidence intervals for every synthesized pixel. To validate reconstruction accuracy, researchers instructed Claude to mask known ultraviolet sectors and predict their contents blind. After several iterative refinements, the model predicted hidden ultraviolet emission levels to within approximately 10% of ground-truth measurements, achieving margins imperceptible to the human eye.
Following the generation of the diffuse ultraviolet background, Claude integrated point-source emissions from individual stellar bodies. The system processed visible-light astrometry from the European Space Agency's Gaia satellite, which cataloged precise spatial and brightness parameters across the galaxy. Claude calculated ultraviolet emission estimates for more than 100 million individual stars, overlaying these stellar sources directly onto the inpainted diffuse gas and dust structures.
04Atmospheric glow correction across circular footprints
Early iterations of the compiled ultraviolet map revealed subtle optical defects in the dimmest celestial fields, appearing as faint circular boundaries with slight contrast variations. These circular artifacts represented the circular footprints of individual GALEX telescope pointings, which captured residual ultraviolet airglow emissions from Earth's upper atmosphere. Because atmospheric glow varied across different orbital passes, adjacent exposures displayed slightly mismatched baseline intensity levels.
Although Claude logged atmospheric glow as a potential risk factor early in the project, the defect bypassed two successive rounds of automated peer review by evaluator agents. Brice Ménard detected the circular imprints during visual inspection of dim fields and prompted Claude to eliminate the footprints, stating, "I can see discs with the imprint of individual observations; can you correct that?" The system traced the error to uncorrected atmospheric offsets embedded across the original raw observational metadata.
Claude subsequently executed an automated recalibration script across all 38,000 individual GALEX telescope observations, subtracting the variable atmospheric glow baseline from each circular frame. The corrective routine executed across several hours of autonomous computation, completely erasing the circular borders and blending adjoining fields into a seamless image. This iterative correction demonstrated how targeted human oversight directs autonomous computational pipelines toward publication-grade scientific precision.
05Collaborative version iterations and computational autonomy
The development of the finished ultraviolet sky map required more than a dozen successive version builds generated across several days of human-AI collaboration. The working routine followed a structured cadence where Brice Ménard formulated high-level scientific parameters and planning instructions within Claude Science. The autonomous system then executed hours of intensive data processing, alignment algorithms, and statistical inference independently while researchers pursued separate academic obligations.
The resulting map delivers an educational tool that enables astrophysics students to examine the Milky Way's structural morphology in far-ultraviolet and near-ultraviolet wavelengths. Every pixel across the entire celestial sphere contains descriptive metadata tags specifying whether the value represents an empirical measurement or an algorithmically predicted estimate. The interactive dataset also embeds explicit local uncertainty values, maintaining rigorous scientific distinctions across all reconstructed regions.
This multi-agent workflow illustrates a repeatable methodology for clearing lower-priority backlogs in astrophysics that typically stall behind urgent research initiatives. By automating tedious data harmonization and cross-calibration routines across historical archives like GALEX, TD-1, and Gaia DR3, scientific teams can synthesize comprehensive observational assets. The project proves that autonomous agent frameworks can execute complex, multi-day data pipeline tasks under high-level researcher supervision.
Frequently asked questions
Why was one-third of the sky missing from previous ultraviolet maps?
Space telescopes like NASA's GALEX skipped areas near bright stars, including the Milky Way plane, to avoid damaging detectors. In addition, atmospheric ozone absorbs ultraviolet radiation, preventing ground-based observatories from filling the gaps.
How did Claude Science predict unobserved ultraviolet regions?
Claude used inpainting trained on relationships between ultraviolet emissions and other wavelengths, including visible, infrared, and radio data. It also integrated estimated emissions from more than 100 million stars cataloged by ESA's Gaia satellite.
How accurate are the predicted ultraviolet measurements?
When tested against deliberately hidden portions of known ultraviolet observations, the model estimated values to within about 10% of real measurements.
What sensor error did researchers identify during the map's construction?
Faint circular footprints from 38,000 individual GALEX observations appeared due to uncorrected atmospheric glow. Brice Ménard flagged the circles, and Claude corrected the atmospheric glow across all observations within several hours.
Sources

Author
Dillip Chowdary
Writes Tech Bytes coverage of AI, engineering, and the tools that actually ship. Editor of Tech Pulse Daily.
Related on Tech Bytes
Advertisement