Claude the Business Analyst: diagnosing a harness ad ROAS drop
Alex Willen shows Claude estimating how a Lone Trail LT2 stockout cut harness ad ROAS from about 5 to 3, using seasonality, inventory and competitor data.
By Dillip Chowdary • Nov 14, 2026 • Source: theautomatedoperator.substack.com
Alex Willen, writer of The Automated Operator newsletter and owner of brands including Lone Trail and Wildgoose, argues that a properly set up Claude is very good at untangling messy questions about a business, in theautomatedoperator.substack.com's report. His Nov. 12, 2026 post walks through how he gives Claude the business context it needs and shows two real analyses it ran for him.
This piece covers the confounders that make business questions hard, the context Willen feeds his agent, how he built that system through trial and error, and the two worked examples. It is written for operators and engineers who want to use AI agents for analysis on top of their own systems of record.
01A hundred confounders behind one price change
Willen's starting point is that owning a business means constant troubleshooting of ambiguous changes with endless possible causes. Even a simple-sounding question, such as how much raising the price of product X changed the conversion rate on its product page, has many confounders.
He lists several: seasonality differences between the measured periods, major changes by competitors, a shift in the mix of traffic sources, outside events such as news coverage, and stockouts of substitute products, either his own or a competitor's. Claude can examine every variable without tiring, he writes, and while there are no perfect answers, the right questions and context give "a pretty good handle on what's going on."
02Seasonality curves, competitor lists and inventory history
To answer that price question, Willen says an agent needs the brand's seasonality curve, a list of competitors and their competing products, a way to evaluate competitor offerings against historical records, traffic data, news search, and historical inventory counts. Some come straight from systems of record like Google Analytics for traffic and Shopify or a 3PL's software for inventory.
Nuance matters, though. Lone Trail sells binocular harnesses, and a search for "binocular harnesses" returns many products that are not true substitutes; a 50% off sale from a high-end brand pulls its products near his price point, while the same sale from a cheap, low-quality competitor barely matters.
His own data needs context too. A seasonality curve built from raw sales would undershoot a period when a shipment was lost at sea and he raised prices and cut ads ahead of a stockout, and overshoot a period when test ad campaigns sold extra units at a loss.
03Trial-and-error setup since Claude Sonnet 4.5
Advertisement
Tech Pulse Daily
Get tomorrow's pulse first
Join engineers who read Tech Pulse before stand-up. Free, weekday mornings.
Willen says his Claude setup now captures just about everything that affects his brands, so recurring tasks like inventory planning and one-off analyses get the adjustments a superficial system would miss. Getting there took trial and error: he would notice it telling him to underorder inventory, find that it ignored a stockout, then instruct it to track stockouts and adjust the inventory projection skill.
He has been building these systems since Claude Sonnet 4.5 was the state of the art. With Opus 5.5, and likely Fable 5.2, which he is still testing, he suggests readers can link the post and ask Claude to work out everything it needs to know, build a system to track it, and backfill it from their systems of record and communications.
He frames the limit with a poker line: the greatest superintelligence "won't fare nearly as well against me at a poker table as a dumb guy who can see my cards." Intelligence draws connections, he writes, but it still needs the information.
04Lone Trail's LT2 stockout and a ROAS drop
Lone Trail sells two binocular harnesses: the cheaper best-selling LT1 and the higher-end LT2, which has more storage and a sound-dampening fabric coating for quieter movement through brush. Willen bought the brand this year; the LT2 had been added at the start of the year, and when fully stocked about 33% of harness buyers chose it, until it sold out in early October.
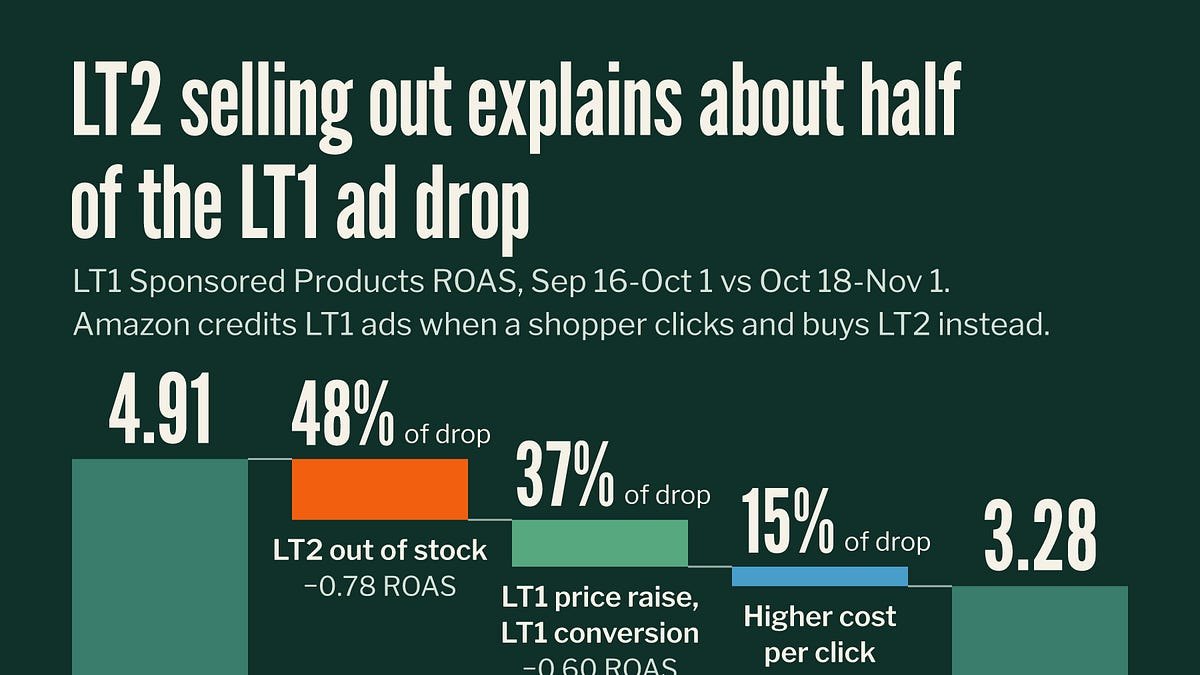
His return on ad spend for harness ads fell from about 5 in September to closer to 3 in the back half of October, so he asked Claude how much of that drop came from the LT2 stockout. Claude had to handle a major confounder, since Willen raised the LT1 price just as the LT2 sold out, plus rising keyword bid costs deeper into the season.
Willen says Claude ran a more thorough investigation than he would have and produced a reasonable estimate with appropriately wide error bars. It also found that LT2 buyers were mostly people who would not have bought an LT1, meaning the product expanded the buyer pool rather than upselling existing buyers.
05Wildgoose's November sales dip
Wildgoose sells binders and boxes that help gardeners keep seed packets organized. The brand was in decline when Willen bought it, then held roughly even year over year for a few months after he enrolled its ad account in a bid management tool he built with Claude.
Since the start of November, sales slipped back to about where they were before the bid manager. Willen asked a short prompt, "What's causing the drop in WG sales this last week?", and Claude went straight into the data.
Willen highlights one distinction in the findings as especially important: a drop caused by lost market share is very different from a drop where the brand holds its share while the whole market softens.
Claude the Business Analyst: diagnosing a harness ad ROAS drop news FAQ
What context does Claude need to act as a business analyst?
Alex Willen lists the brand's seasonality curve, competitors and their products, a way to evaluate competitor offerings with historical records, traffic data, news search, and historical inventory counts. Some of it comes from systems like Google Analytics, Shopify or a 3PL's software.
How much did the LT2 stockout affect Lone Trail's ad performance?
Harness ad ROAS fell from about 5 in September to closer to 3 in late October. Claude estimated the LT2 stockout's share of that drop with wide error bars, after accounting for an LT1 price increase and rising keyword bid costs.
Which Claude models does Alex Willen use for business analysis?
He has built his systems since Claude Sonnet 4.5 was state of the art and says Opus 5.5, and likely Fable 5.2, can set up a similar system from a single prompt.
What did Claude find about LT2 buyers?
Claude found LT2 buyers were mostly people who would not have bought the cheaper LT1, so the LT2 expanded Lone Trail's buyer pool instead of upselling existing customers.
Sources

Author
Dillip Chowdary
Writes Tech Bytes coverage of AI, engineering, and the tools that actually ship. Editor of Tech Pulse Daily.
Related on Tech Bytes
Anthropic's Model Taught Itself to Run on AMD in "Three Days."
Read →
Constellation Space launches its platform for managing fleets of satellites with AI tools
Read →
What a week of Claude Code holds: the usage meter, per token type
Read →
Nvidia’s Jensen Huang resigns, chipmaker names CFO Colette Kress as interim CEO
Read →
Today's Tech Pulse briefing
Full briefing →
Advertisement